
How to Look Up Hampden County Jail Population Data
The Sheriff's Office publishes official research, including recidivism reports and annual release reports, on its public-information research page. Those reports are the main source for Hampden County population figures, and they are released periodically rather than updated live. Find them at the Hampden Sheriff research reports page.
Read them as official annual snapshots. A figure labeled average daily population reflects a calendar or fiscal year, not the count on the day you read it.
Hampden County Jail Capacity Overview
The Sheriff runs several facilities with different roles. Some capacity figures come from older PREA audits and should be read as rated or historical context rather than a current count. Where an audit gave a recent population, it is shown below.
| Facility | Capacity (audit) | Population (audit) |
|---|---|---|
| Hampden County Correctional Center, Ludlow | 1,301 main plus 218 pre-release (2015 audit) | Historical context only |
| W. Mass. Regional Women's Correctional Center | 352 designed (2022 audit) | 154 current, 127 ADP (audit) |
| W. Mass. Recovery and Wellness Center | 149 designed | 63 current, 47 ADP (audit) |
Treat the Ludlow figures as rated or historical until a current capacity report is published, since older audits can lag real bed counts. Capacity is also more than a single number, since the Sheriff runs main correctional housing, pre-release housing, women's correctional housing, recovery and wellness placements, civil-commitment treatment, and community programs through different sites, each with its own rules.
Average Daily Population
The 2024 recidivism report gives a calendar-year 2023 average daily population of 1,005 in-custody and 85 out-of-custody individuals. That report also describes about 83.3 percent men and 16.7 percent women. The same source counts 5,335 annual releases in the 2023 Annual Release Report, which shows how much movement happens through the jail in a year.
Average daily population and annual releases measure different things. The first is roughly how many people are held on a typical day. The second counts how many people left custody over the year, a much larger number because people cycle in and out.
Demographic Breakdown
The clearest demographic figure in the Sheriff's reports is gender. The 2024 report's calendar-year 2023 data breaks down as shown below. Detailed race and age breakdowns are not reproduced here without a current official source.
| Group | Share of Population |
|---|---|
| Men | About 83.3 percent |
| Women | About 16.7 percent |
The women's population is served largely through the regional women's center in Chicopee, which serves Hampden County and other Western Massachusetts counties as a regional facility rather than a county-only site. That regional role is one reason the women's population is counted and reported separately in HCSO research.
Pretrial vs. Sentenced Population
County jails hold two main groups: people awaiting trial and people serving a county sentence. A specific pretrial-versus-sentenced percentage was not published in the reports reviewed, so the table describes the categories rather than fixed shares. Pretrial detainees are legally presumed innocent and should not be described as convicted.
| Group | What It Includes |
|---|---|
| Pretrial | People held while their case is pending, presumed innocent. |
| Sentenced | People serving a county sentence after a conviction. |
| Treatment / civil commitment | People at treatment sites, counted separately from the jail. |
| Out-of-custody | People supervised in the community through county programs. |
Misdemeanor vs. Felony Population
The reports reviewed do not give a clean misdemeanor-versus-felony split for the county jail. In general terms, a county jail holds people on a mix of misdemeanor and felony matters, including pretrial holds on serious charges that may later move to Superior Court. Without a current official breakdown, this page does not assign a percentage to either group.
Mental Health and Medical Population
Part of the county's correctional population is connected to treatment rather than ordinary jail housing. The Stonybrook Stabilization and Treatment Center in Ludlow holds civilly committed men, and the Recovery and Wellness Center in Springfield runs treatment programming. Those populations are reported separately from the main jail count, which is one more reason a single headline number can mislead.
National and State Context
County figures make more sense next to state and national data. The comparison below frames the sources rather than inventing a single per-100,000 rate, since the county reports and national datasets measure on different terms.
| Level | Source and Measure |
|---|---|
| Hampden County | Sheriff reports; ADP about 1,005 in-custody for 2023. |
| Massachusetts | State context through DOC and the Prison Policy Initiative profile. |
| National | Bureau of Justice Statistics jail trends and pretrial shares. |
The Prison Policy Initiative profile provides state-level incarceration and supervision context for Massachusetts.
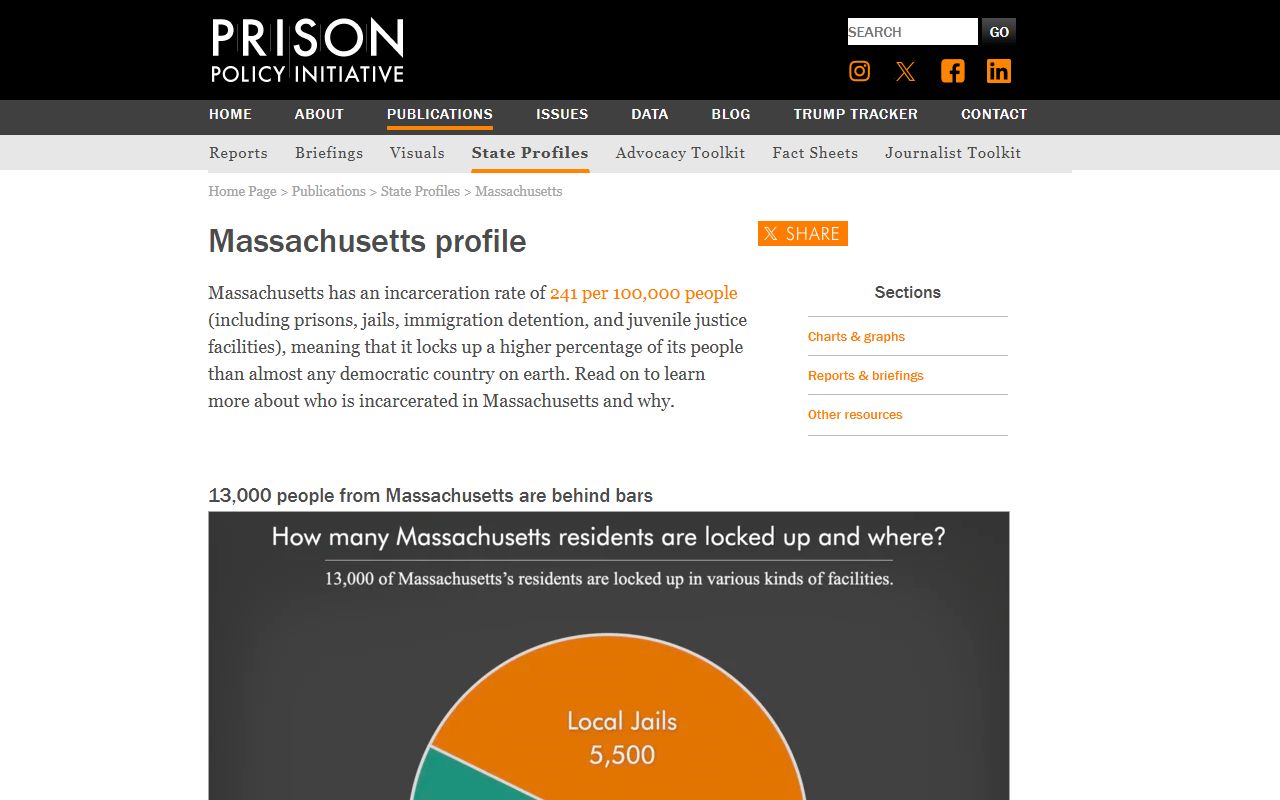
For national jail trends, the Bureau of Justice Statistics publishes admissions, releases, and demographic patterns, which help frame the Hampden County numbers against the rest of the country.
Population Trends Over Time
The Sheriff's reports show a rebound from pandemic-era lows. The 2022 report gave 855 in-custody and 57 out-of-custody. The 2023 report gave 985 in-custody and 72 out-of-custody. The 2024 report gave 1,005 in-custody and 85 out-of-custody for calendar 2023. Annual releases rose across the same reports, from 4,167, to 4,819, to 5,335. These are official research figures, not a live daily count. The same reports also describe gender distributions and program participation, useful for putting any single year in context. Looking at three reports side by side gives a sense of direction that a single number cannot.
Key Interpretation Points for Jail Population Data
A single headline number rarely tells the full story of a jail. The same population can look bigger or smaller depending on whether you count beds, ADP, admissions, or releases. Keeping a few rules in mind makes the figures more honest.
- Average daily population is not the same as rated capacity.
- Annual bookings are not the same as the number of people held on any single day.
- Pretrial detainees are legally presumed innocent and should not be described as convicted.
- Sentenced county inmates are different from state prison inmates.
- Federal holds, ICE holds, and out-of-county holds should be reported only when an official source confirms them.
Treat any single year as a snapshot, since the size and makeup of the jail population shift with policing, court schedules, bail decisions, and public-health events.
Why Hampden County Jail Numbers Change
Jail populations move every day. New bookings raise the count. Releases, transfers, and sentencings cut it. Court schedules, bail commissioner decisions, and a single high-profile case can shift the picture in a short window. Treatment and recovery placements also move people between facilities without anyone leaving county control. That is one more reason a calendar-year average is more reliable than a one-day count.
External events drive longer trends. The pandemic-era dip and rebound shown in the Sheriff's reports is one example. Policy changes, sentencing reform, and shifts in pretrial practice can each move ADP up or down across multiple years.
Searching for Hampden County Inmate Records by Name
This page covers aggregate jail population data, not individual lookups. To check whether a specific person is in custody, use the Hampden County inmate records page, which explains the working custody-verification tools.
Where the Data Comes From
The county figures here come from Hampden County Sheriff's Office research reports, including recidivism and annual release reports. National and state context comes from the Bureau of Justice Statistics jail data and the Prison Policy Initiative Massachusetts profile.
When the Sheriff has not published a specific number, a public-records request to the agency's Records Access Officer is the lawful route to aggregate population records.
Ask for aggregate figures, such as monthly average daily population by facility, rather than confidential inmate-level data.